Journey Map 1.1 - Teacher Views TB Dashboard Results - Starting from Techbook


2

Get to Data
1- Click on Dashboard Icon on
Concept Tool Tray.
2- Select Class
3- Navigate to Dashboard section
that corresponds to the data you
are intersted in.
4- Find specific question(s)


3


2
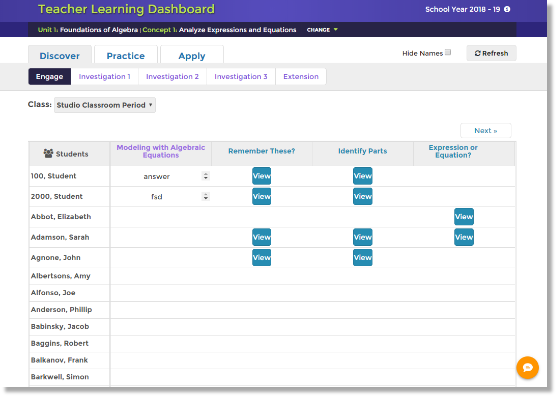
Challenges include:
• Only 4 questions display without pagination
• Progressive loading of student list makes it difficult to view all students.
• The matrix is challenging to identify trends without filtering
• Inconsistant displays for Constructed Response results
Understand Partipicipation
5- Which students have completed?
6- Which students need
to be graded?
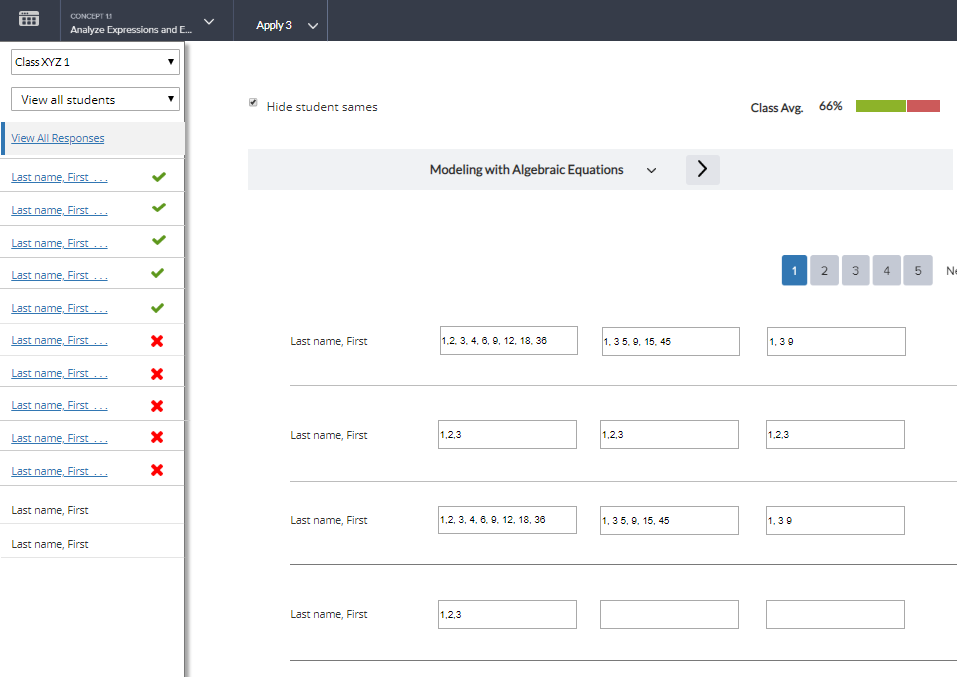
7- What are the responses for Constructed Response?
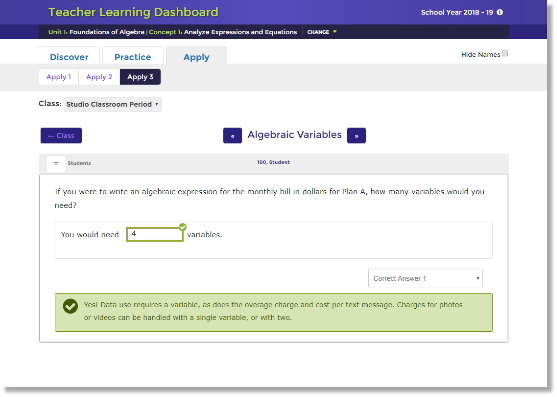
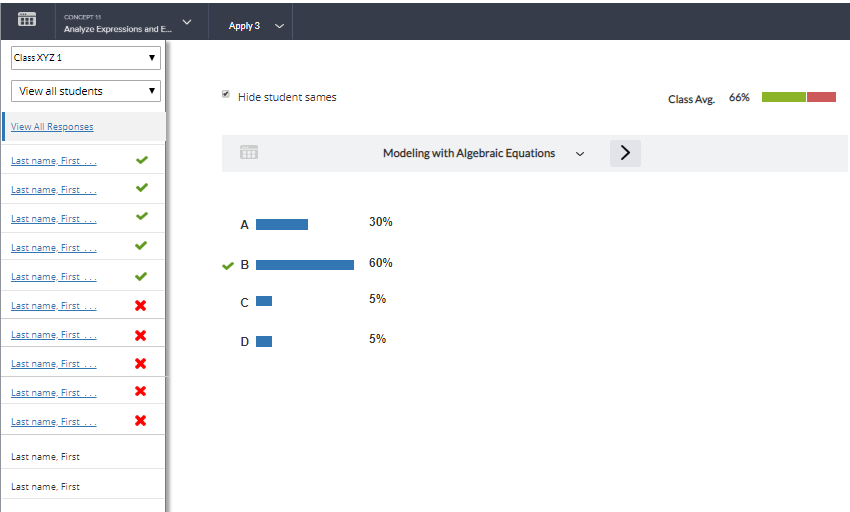
Understand Performance
Evaluate Responses
TASK FLOW
AS IS SCREENS
4

5


8- How is the class doing?
9- Which question is the most problematic
10 - Which students are struggling the most?
11- Have a class discussions about what students are submitting
6


8

12


12 - What are the responses?
13- What are the common incorrect answers?
14 - Grade all students for one question
15- Reset question so student can resubmit
10
9
14
13


Challenges include:
• Combined with the dependency on the "blue view" button, there is an inefficient workflow between student and class view.
• Student navigation not useful wIthout completion or scoring information
• Item analysis missing which results in Inability to compare results or evaluate misconceptions
3
4
5
6
7
8
9
10
11
12
13

15
TO BE SCREENS
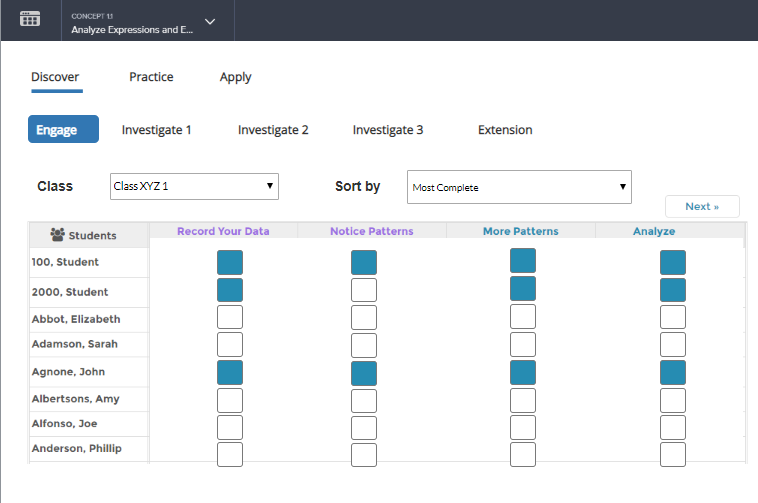
Simplify matrix view to only supports navigation to question level results. Eliminate need for pagination by narrowing columns, add filtering so there is less need to translate the matrix. Also added support for filtering to help better leverage the simplified data.
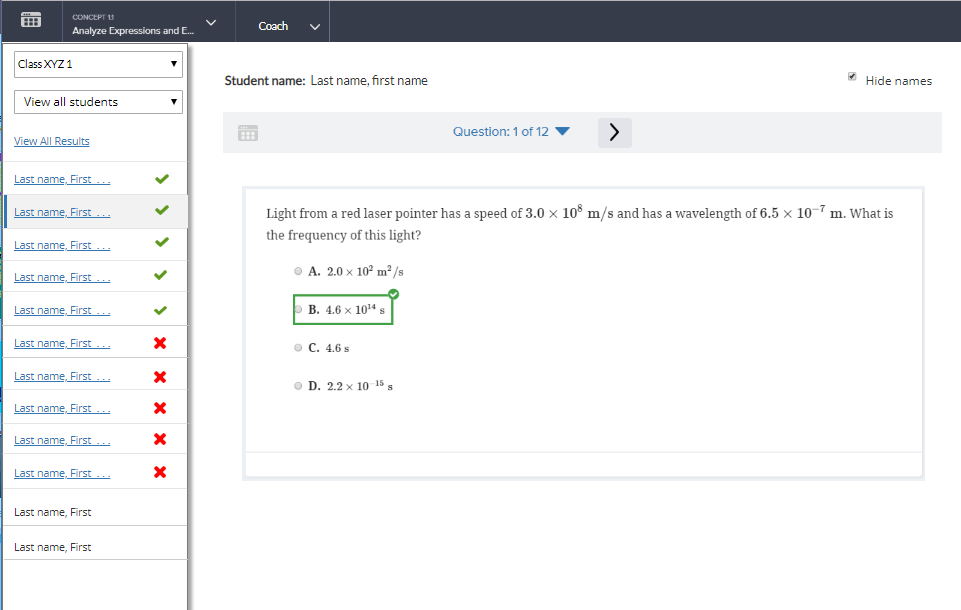
Shift support for question results to the Question level view where new navigation and information can better support the teacher for both graded and non-graded scenarios whether viewing, evaluating and grading results.
Matrix
Question Level
All Responses
Matrix
Question Level

Provide better navigation and displays to reduce back and forth navigation to the Matrix.
Opportunities for new functionality like "resetting"
7


Provide filters to analysze the matrix
Simplify experience for Constructed Response.
Reduce pagination frequency
Reduce navigation task by providing contextual launching


Ease of Use
Opportunities
* Ease of use is determined by a combination of number of clicks, external feedback and also heuristic obserservations
11